ÆDONYX Discuss a project

Case studies

Selected projects.

01 04

Software I built for engineering and construction teams. These entries describe the tools, the work they supported, and my contribution.

Case studies01 / 04

01

Internal tools platform

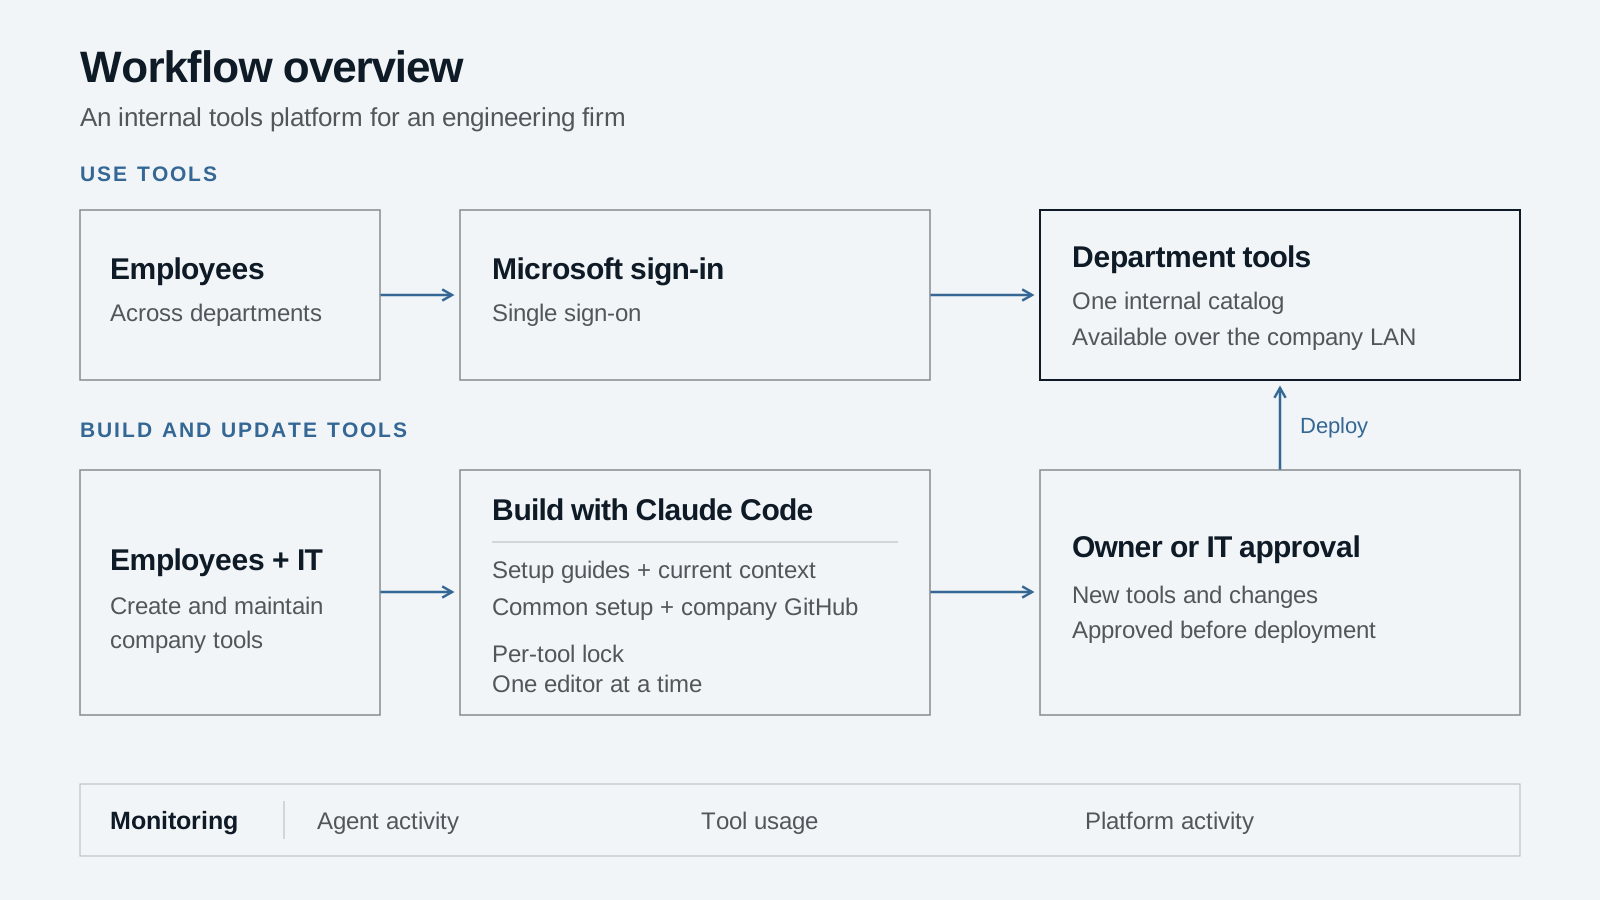
I built a shared platform for an engineering firm. Employees used department tools and built new ones with Claude Code, shared setup and IT approval.
Built for an engineering firm

Workflow overview: employees use Microsoft sign-in to access department tools. Employees and IT develop with Claude Code, shared guides and context, company GitHub and tool locks. The owner or IT approves tools and changes before deployment. Monitoring covers agent activity, tool usage and platform activity.
Fig. 01Workflow illustration based on my project description
Read more

The platform

I built a centralized platform for an engineering firm that employees could access over the company's internal network. They signed in through Microsoft single sign-on and found tools organized by department. I built several of those tools, including a program that compiled Synchro report data into tables.

The platform also gave employees a way to start building their own tools with Claude Code. I wrote setup guides and taught IT staff how to use it. Their agents automatically received current information about the platform, the existing tools, and how to set up a new tool. Common setup work was already built into the platform, and the work went through the company's GitHub.

I added a locking system so two people could not work on the same tool at the same time. Creating a new tool required approval from me or IT. Deploying changes to an existing tool also required approval. The platform included monitoring for Claude Code activity, tool usage, and other aspects of platform operation.

IT staff used the system to build and deploy tools of their own. The guides and shared context helped them learn how to work with AI agents while following the platform's setup and approval process.

Example: Synchro report tables

Engineers were manually copying data from Synchro reports into tables for their reports. I built a tool that read the exported PDFs and populated those tables using deterministic code. The data transfer did not use an AI model.

Different offices needed different table formats. Pennsylvania and New York staff, for example, prepared tables differently for their respective state DOTs. I built a table studio where users could define how values from the source report mapped to their table format.

The tool showed a table preview beside a PDF viewer. Clicking a table cell highlighted the source value in the PDF so an engineer could check where it came from. The tool flagged some problems, but the checks did not catch everything. Engineers remained responsible for reviewing the result. The source links also made it easier to investigate a value that looked wrong, including a possible error in the original Synchro work.

Example: Observed trip generation

For a transportation management plan at UBS Arena, traffic counts were collected at roughly eight to ten entrances and exits during hockey games and concerts. The counts came from automatic traffic recorders or video cameras. I built a tool to compile the collected counts for the event analysis.

The tool used event start and end times to define the analysis windows. It identified the highest entering and exiting volumes and the peak hours within those windows, then generated tables for our reports.
Case studies02 / 04

02

Crash Data Analysis

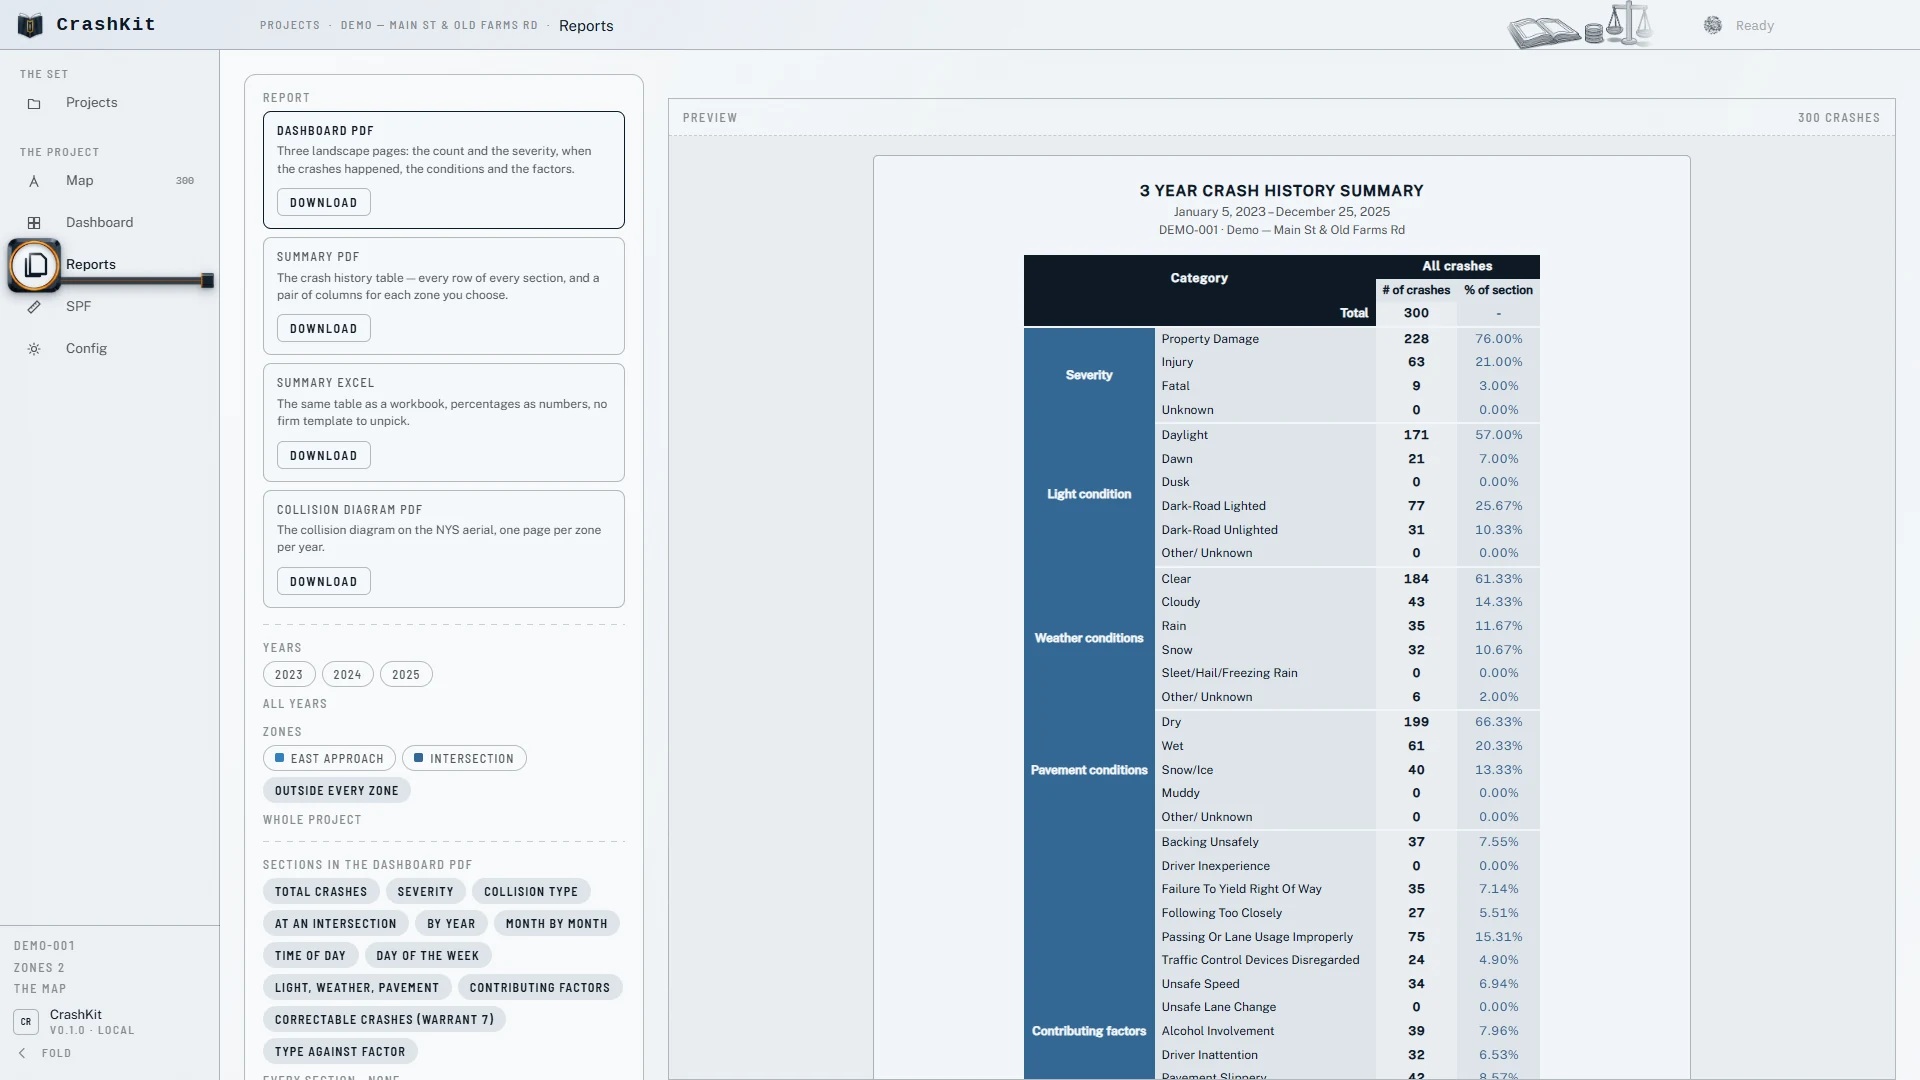
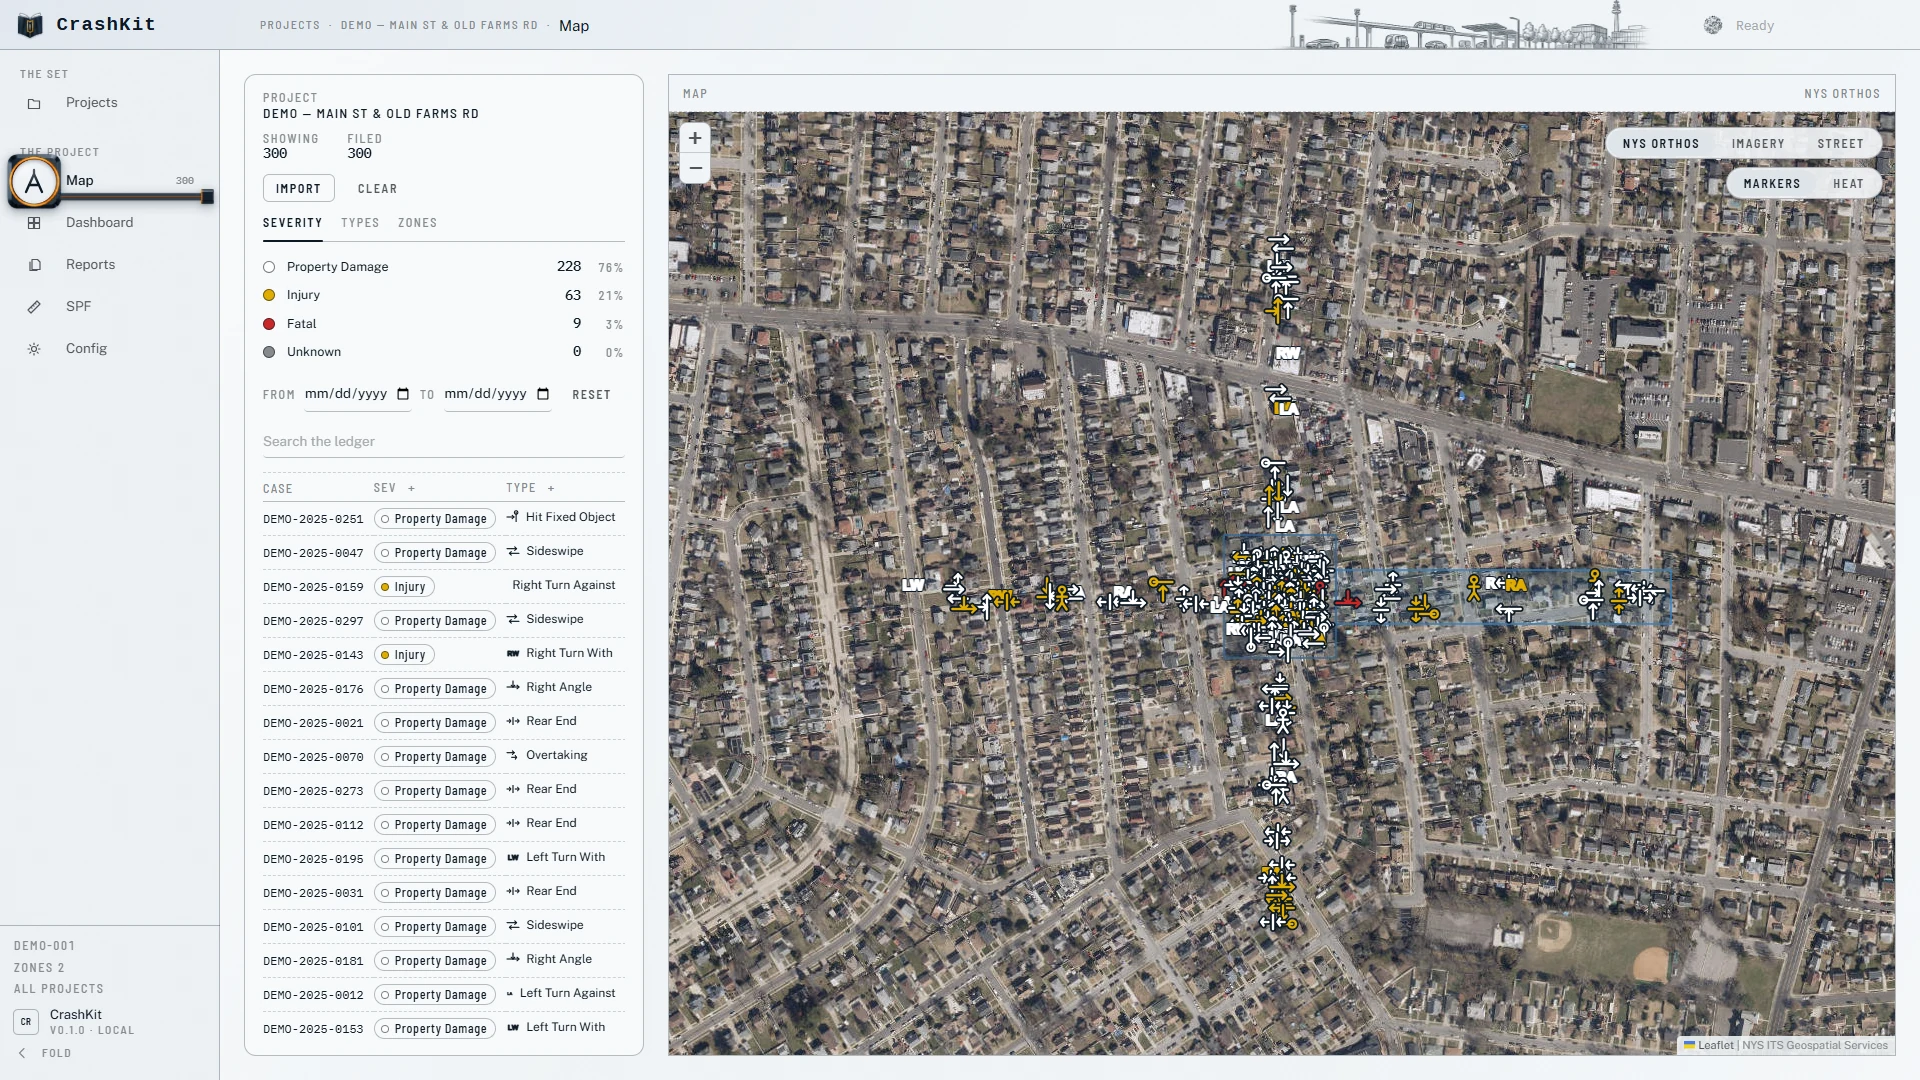
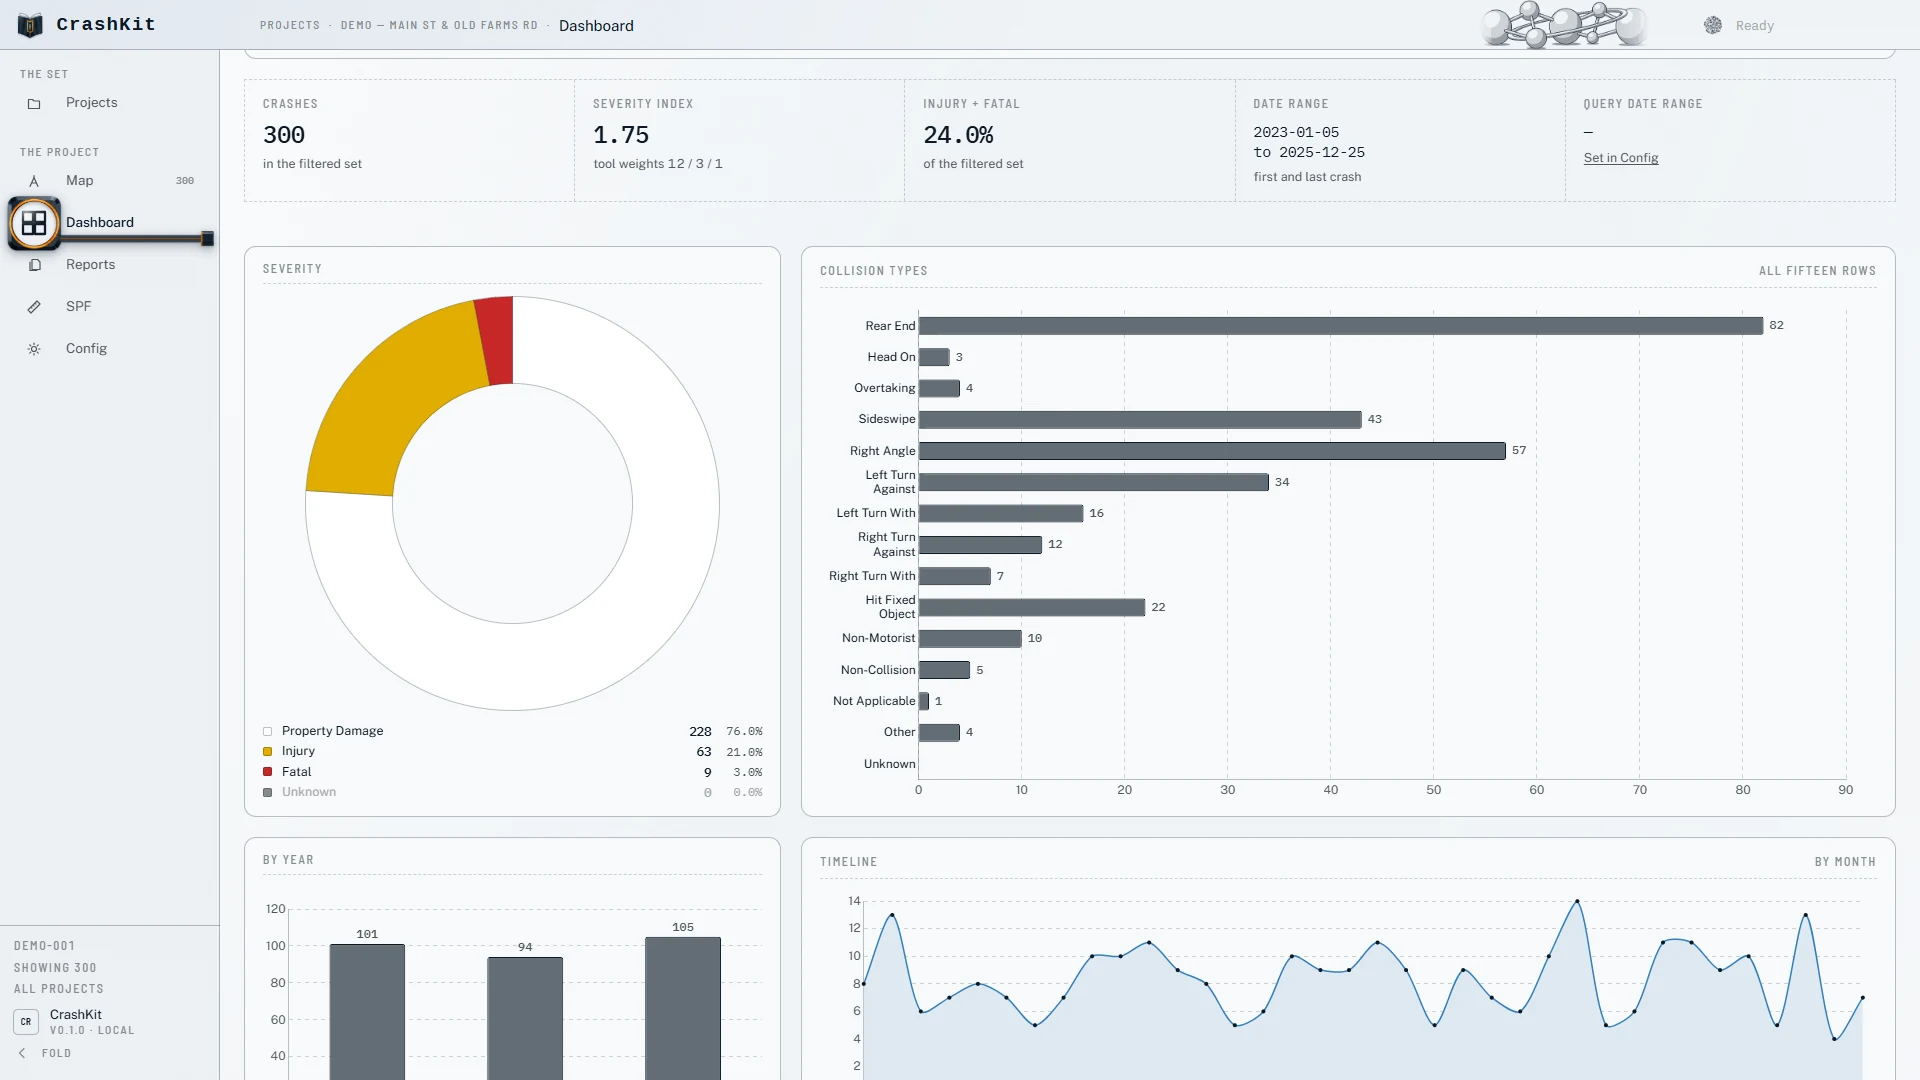
A DOT crash export in, a case out: every record mapped by zone, an interactive dashboard, a Signal Warrant 7 check and a multi-page PDF report.

2024 – present · Synthetic demo data shown

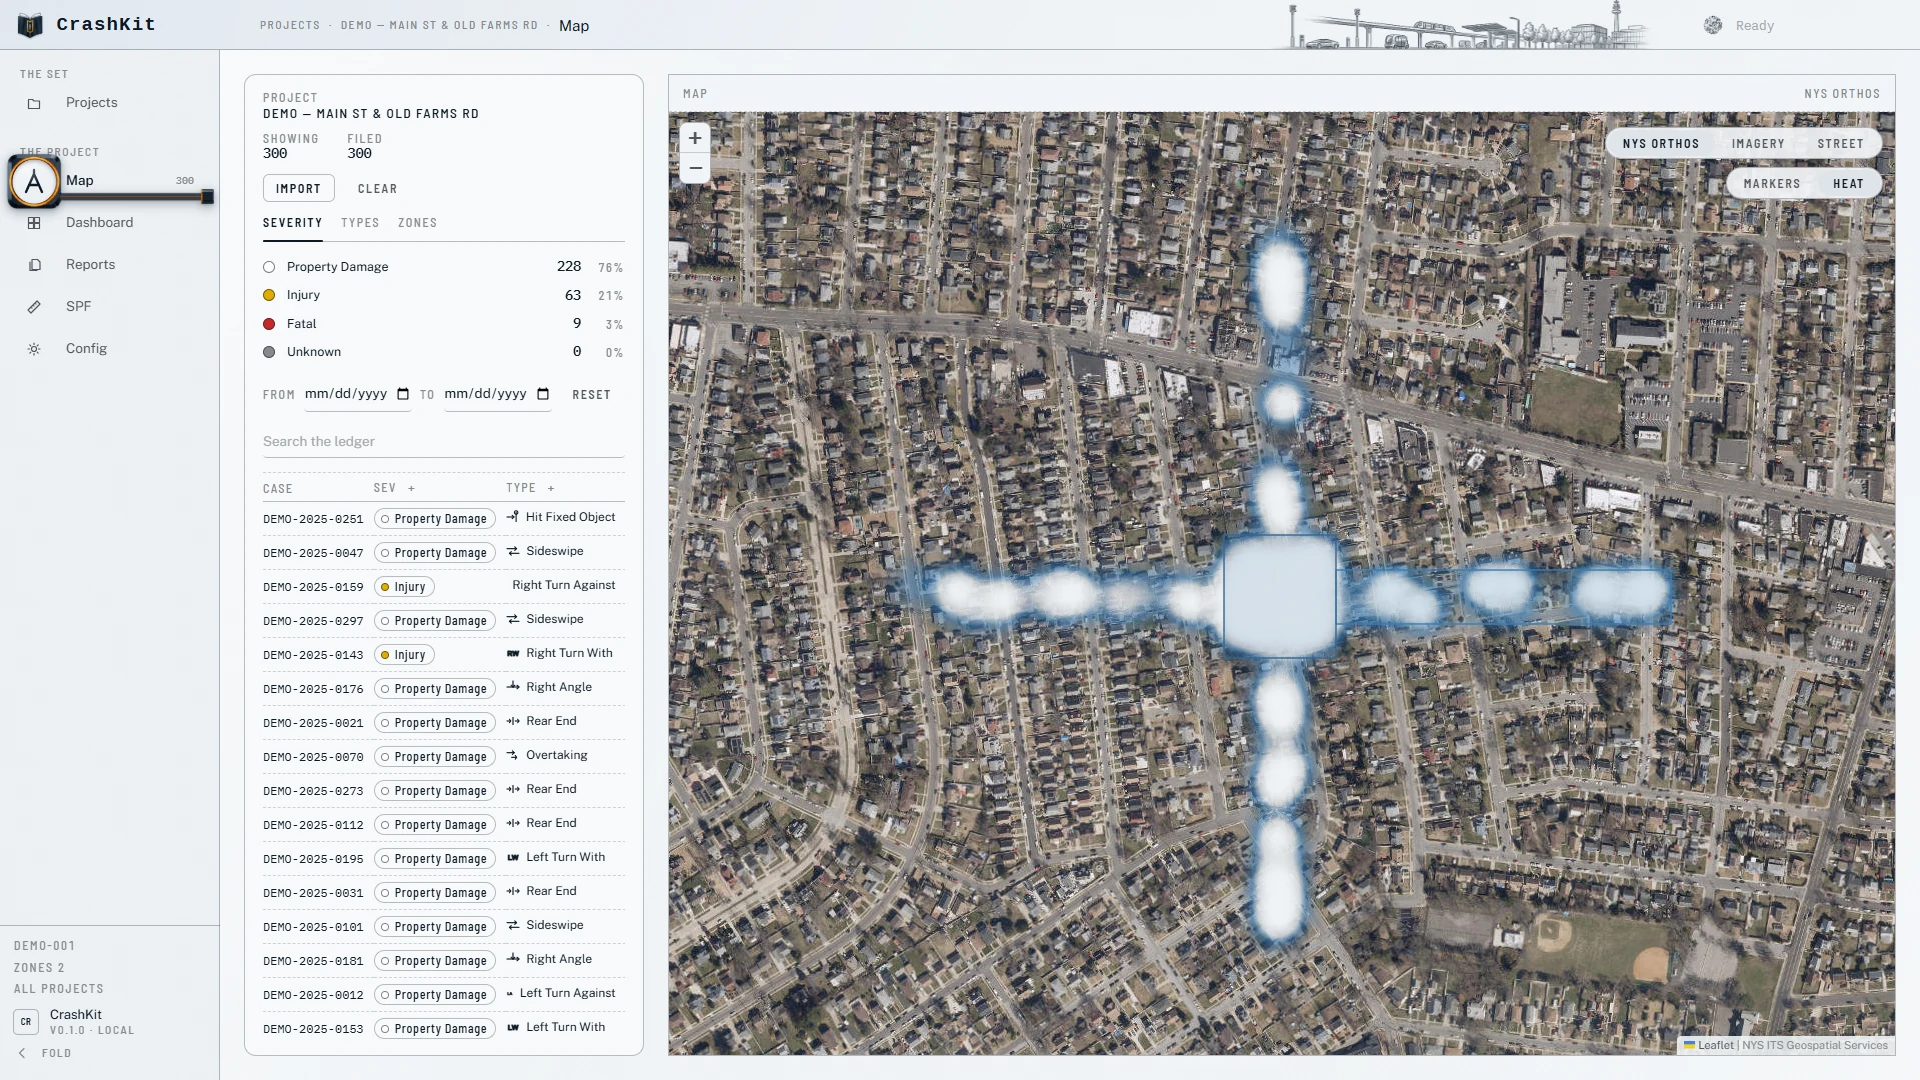
The crash tool's map: a fictional Main St and Old Farms Rd job with synthetic crashes marked by severity over an aerial.
Fig. 02Crash mapping · Synthetic demo data
Read more

What it does

  • Zone-based crash mapping with severity markers over an aerial.
  • Dashboards with severity, collision-type, time and trend charts, filtered across each other.
  • Signal Warrant 7: rolling twelve-month correctable crashes per zone.
  • A configurable visualizer with twelve chart types.
  • Auto-generated multi-page PDF crash analysis reports.
Case studies03 / 04

03

SOPs and standards

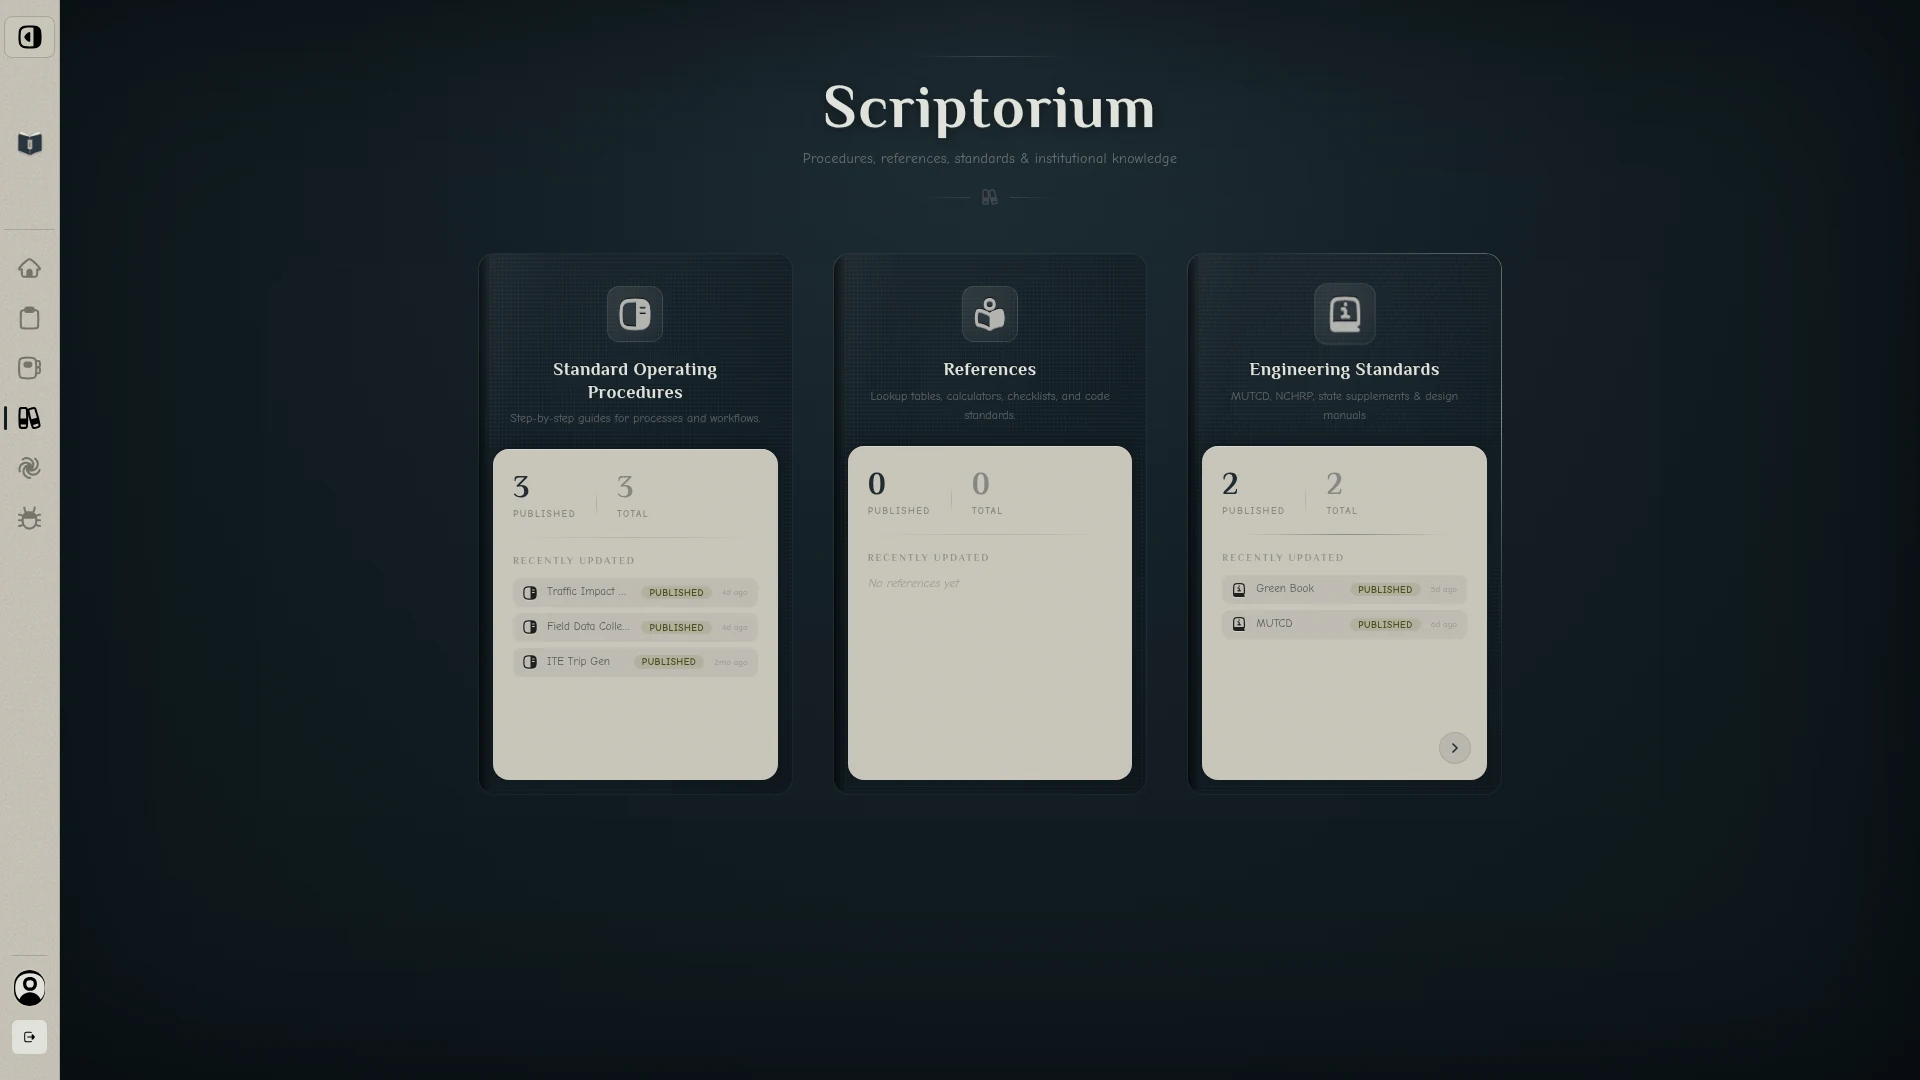
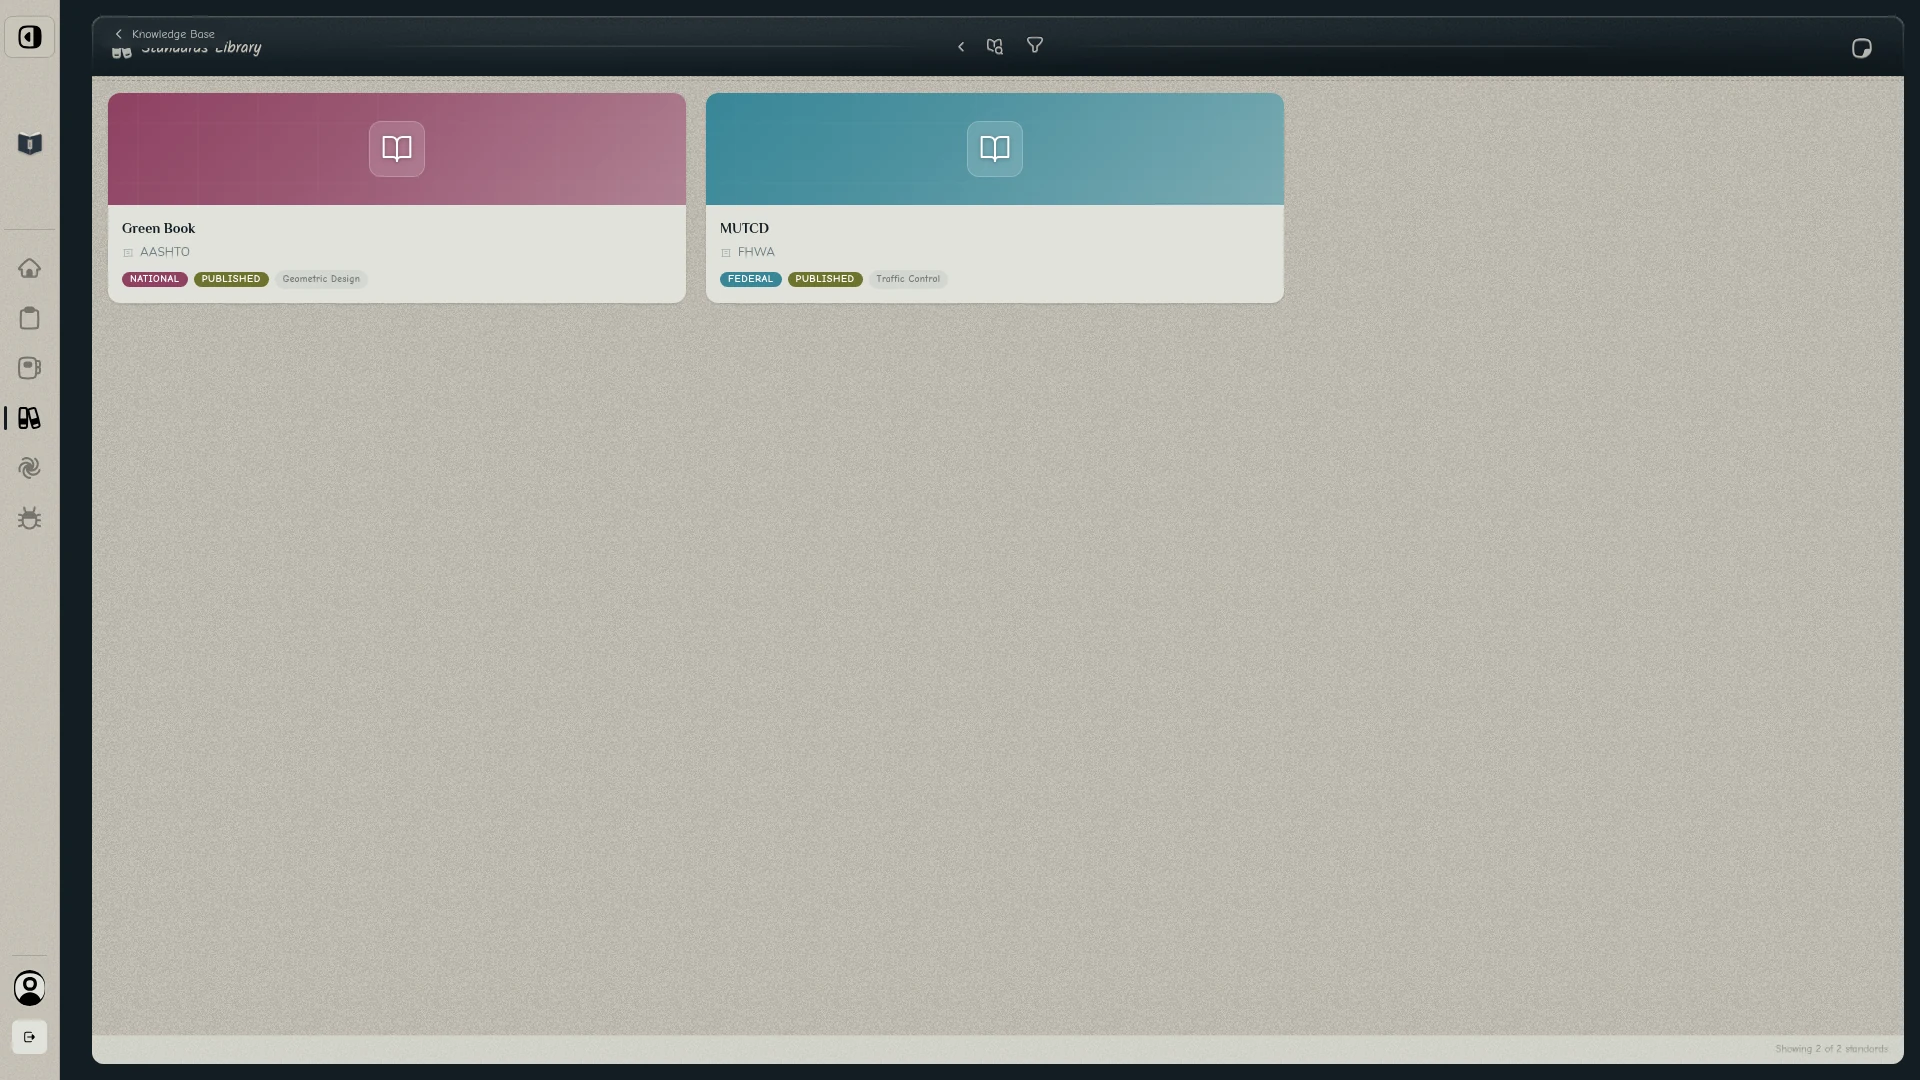
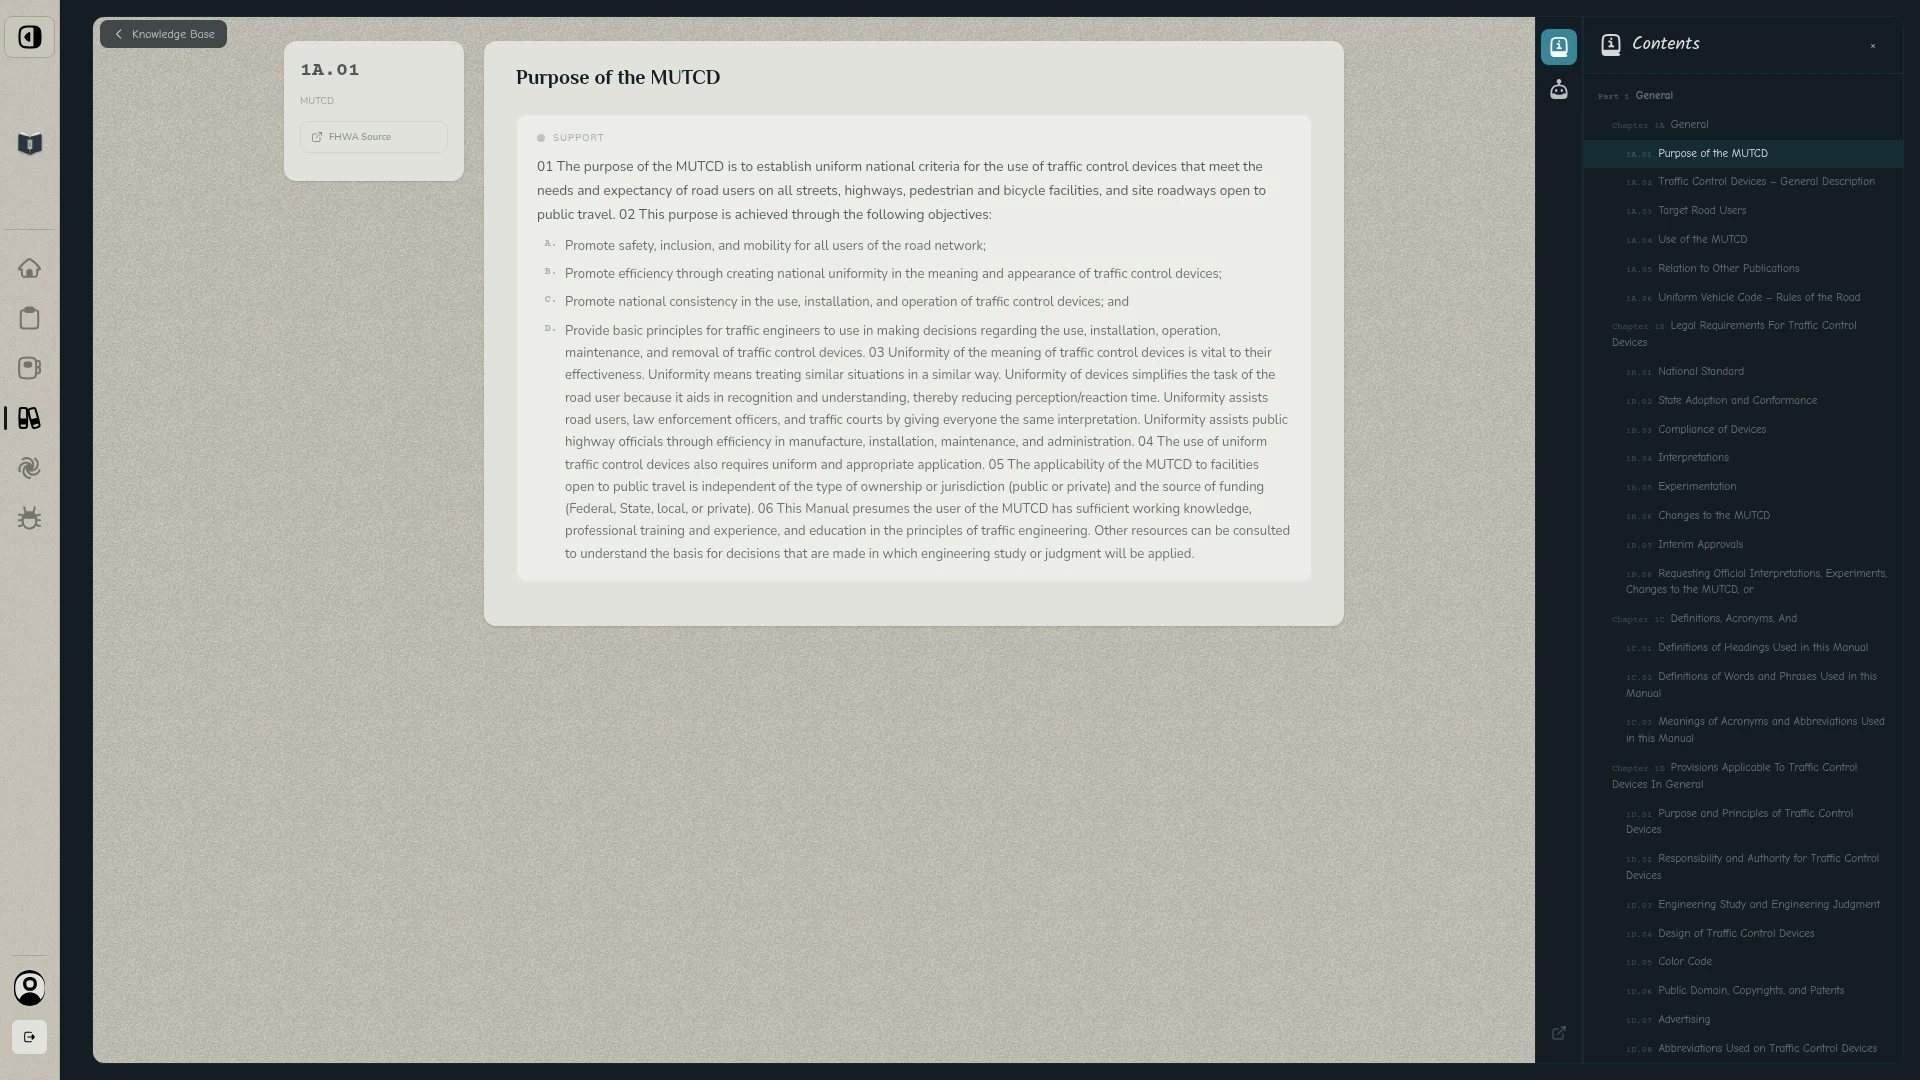
An engineering team’s procedures written as phases, tasks and steps, beside a standards library with full-text MUTCD and Green Book viewers and a whiteboard on every step.

2025 – present

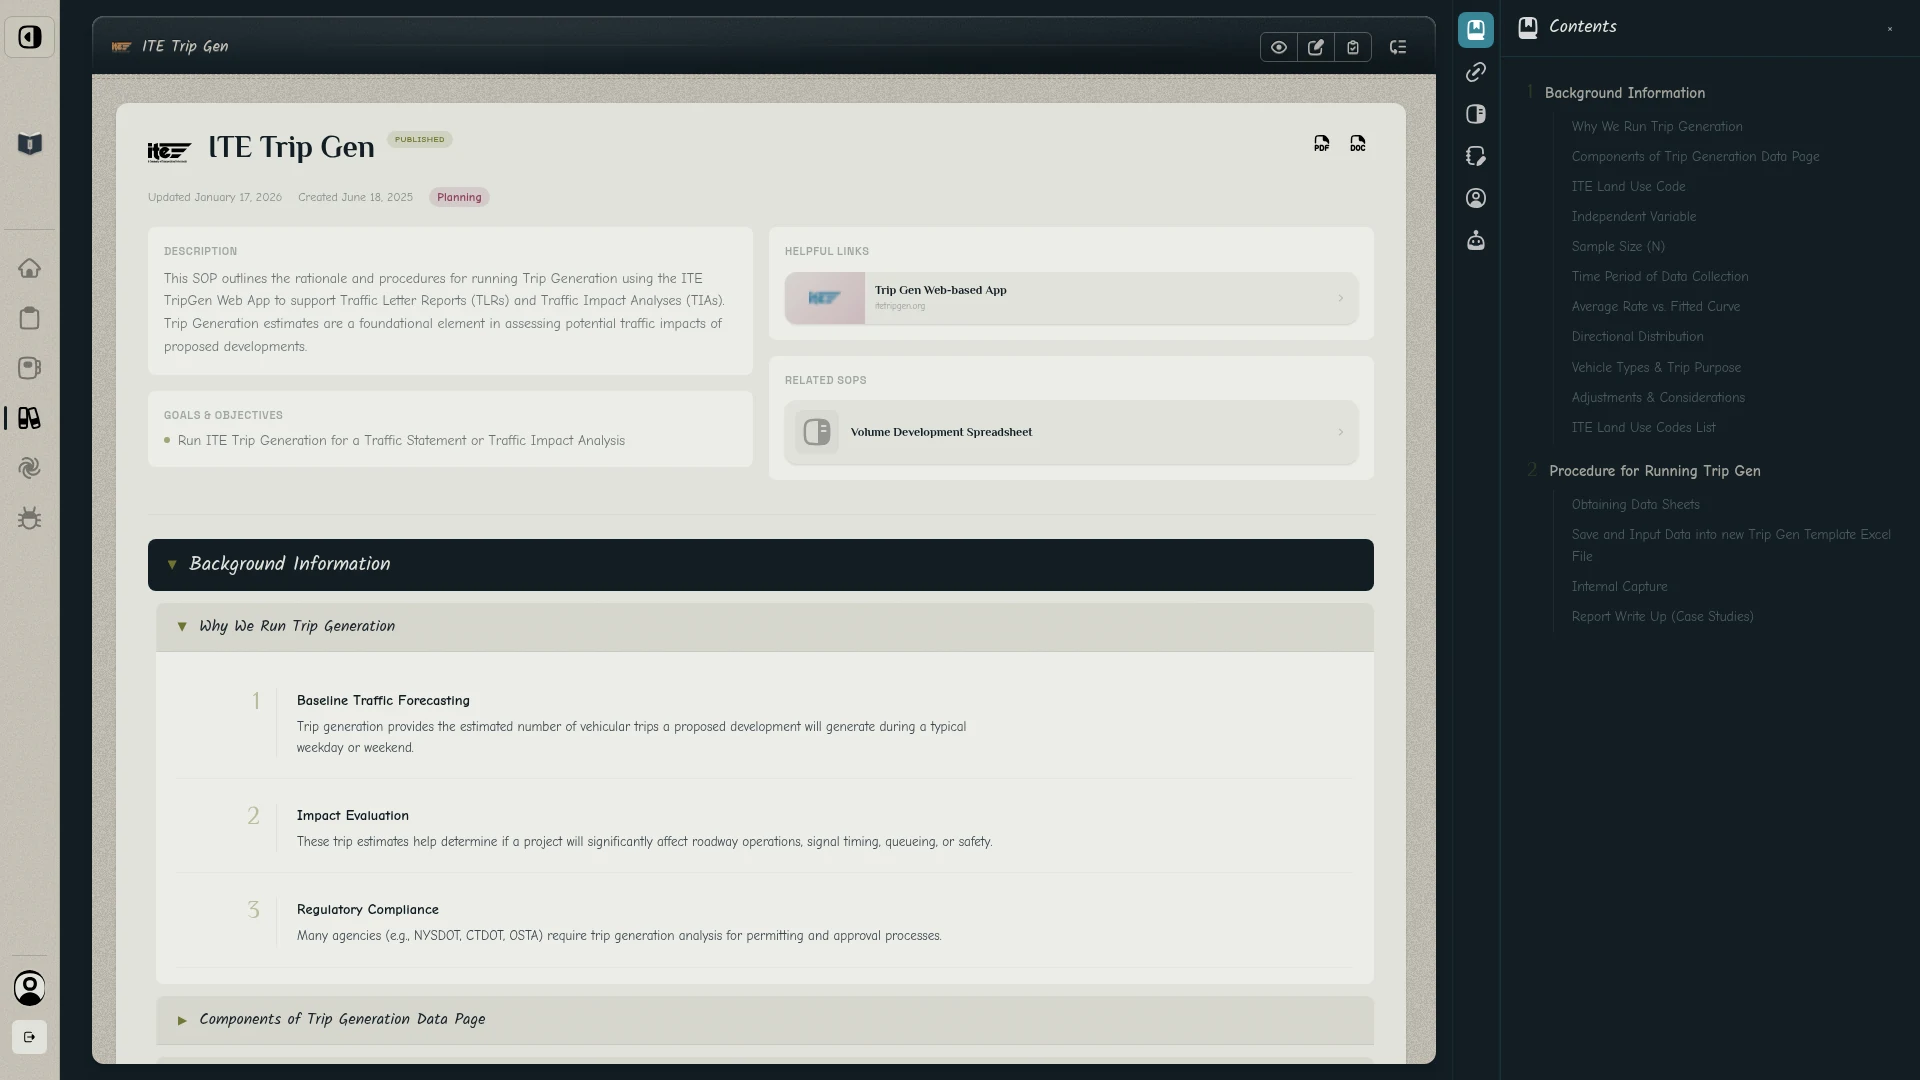
An SOP open in Scriptorium: the ITE trip generation procedure with background, purpose and numbered steps beside a contents rail.
Fig. 03SOP view · ITE trip generation
Read more

What it does

  • Phase, task and step hierarchy with images, warnings, verification checkpoints and version tracking.
  • Runbook mode: an SOP executed with progress tracking and completion logging.
  • Engineering standards viewer for the MUTCD and the Green Book, navigated by table of contents.
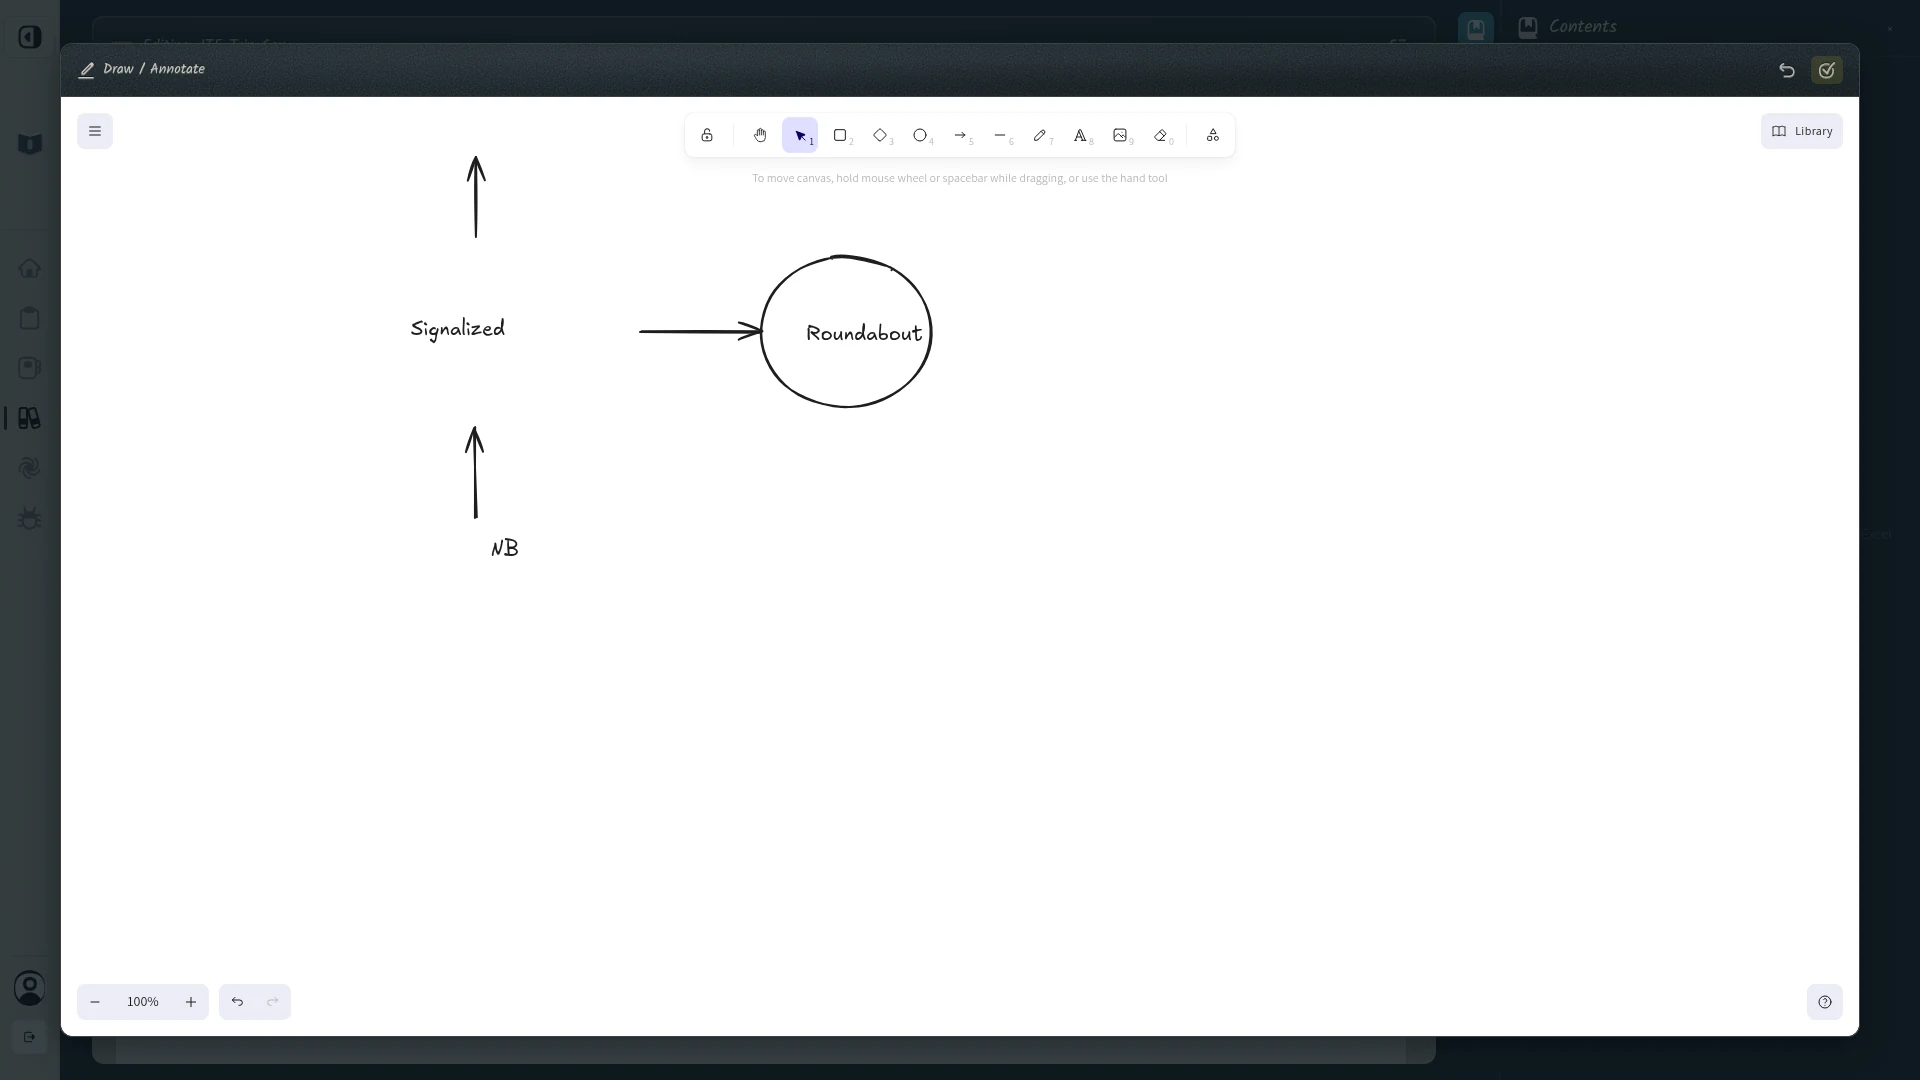
  • Excalidraw diagrams drawn and annotated directly on SOP steps.
  • PDF and Word export with the formatting preserved.
Case studies04 / 04

04

Field records and invoicing

I built a Microsoft Access hub for daily field quantities, municipal invoices and site photos. I also built a map for utility restoration work orders across Nassau County.

Built for Thomas Novelli Contracting Corp.

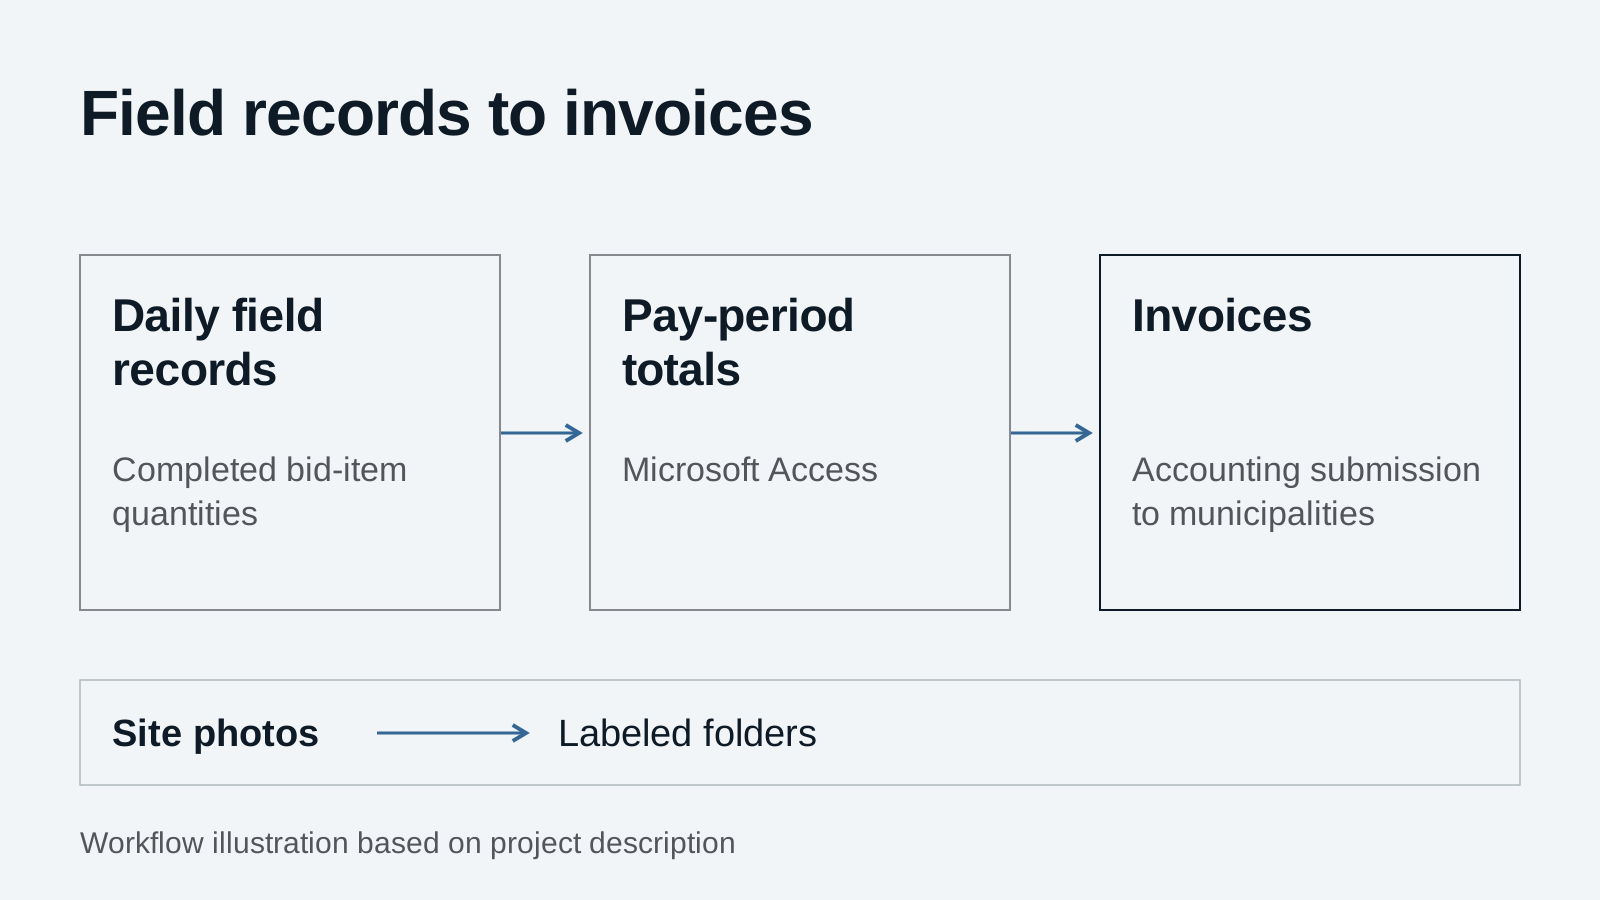
Daily completed bid-item quantities entered by field staff are totaled in Microsoft Access for each pay period and generated into invoices for accounting to submit to municipalities. Site photos are stored in labeled folders.
Fig. 04Workflow illustration based on my project description
Read more

Daily quantities and invoices

I built a Microsoft Access hub where field staff entered the quantities of bid items completed each day. At the end of each billing period, the system totaled those quantities and automatically generated invoices. The invoices went to accounting for submission to the municipalities.

Site photos

Field workers could take photos on site. The hub organized and labeled the images in folders so staff could find them later.

Work-order map

I built a separate map for utility restoration and patching work orders throughout Nassau County using a Google mapping API. Selecting a work order showed its number, location and other details. It gave the boss a map of jobs to use when planning crew routes.

01of 04

Have a workflow you want to improve?

Discuss a project